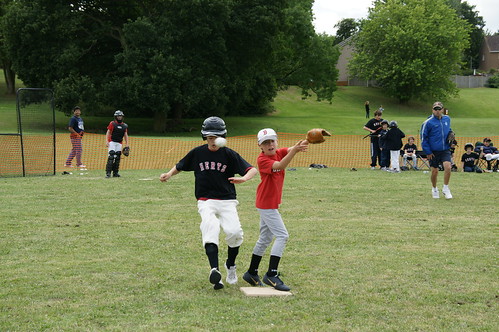
Last Saturday Lewis Paterson hit his third home run of the year and that gives him the lead in the Home Run category, as we go into the final weeks of the 2009 Herts Baseball Little League season. As the number of league games scored increases it is interesting to see the league leaders in other statistical categories.
|
BATTING AVERAGE* |
||
|
Name |
Team |
Avg |
|
Jamie Paterson |
Herts Yankees |
1.000 |
|
Bradley Edgar |
Herts Blue Jays |
0.750 |
|
Marty Cullen Jr |
Herts Yankees |
0.750 |
|
Stella Dixon |
Herts Blue Jays |
0.500 |
|
Lewis Paterson |
Herts Blue Jays |
0.500 |
Batting Average (Number of Hits (divided by) Number of At Bats) is an indicator of a player’s ability to make good contact with the ball. In MLB an average of .300 or higher is considered to be outstanding.
|
SLUGGING %* |
||
|
Name |
Team |
Slug |
|
Jamie Paterson |
Herts Yankees |
1.250 |
|
Lewis Paterson |
Herts Blue Jays |
1.250 |
|
Marty Cullen Jr |
Herts Yankees |
1.000 |
|
Zachary Longboy |
Herts Blue Jays |
0.800 |
|
Bradley Edgar |
Herts Blue Jays |
0.750 |
Slugging Average (Number of (Singles + [2 x Doubles] +[ 3 x Triples] + [4 x Home Runs]) divided by At Bats) A players Slugging Average, or Slugging Percentage, is directly defined as total bases per at-bat. To calculate a player's total bases you award a 1 for a single, a 2 for a double, a 3 for a triple, and a 4 for a home run then add them all together. Divide that by the total number of at bats a player has and you can easily determine the overall number of bases a player generally touches during his at bats. Slugging % is one of the most popular indicators of a player’s ability to hit the ball with power.
|
ON BASE %* |
||
|
Name |
Team |
OBA |
|
Jamie Paterson |
Herts Yankees |
1.000 |
|
Bradley Edgar |
Herts Blue Jays |
0.833 |
|
Marty Cullen Jr |
Herts Yankees |
0.750 |
|
Lewis Paterson |
Herts Blue Jays |
0.667 |
|
Kieran Manning |
Herts Blue Jays |
0.667 |
On Base Percentage ((Hits + Walks + Hit-By-Pitch) divided by (At Bats + Walks+ Hit-By-Pitch + Sac Flys)). The On Base Percentage statistic was originally created to measure the percentage of times a player reaches any base. It is easily one of the most important statistics and it is specifically written with managers in mind.

It is notable, and probably not surprising, that the top 5 performers in these offensive categories all come from the Herts Yankees and the Herts Blue Jays who currently lead in the league standings.
|
PITCHING (EARNED RUN AVERAGE)* |
||
|
Name |
Team |
ERA |
|
Jamie Paterson |
Herts Yankees |
0.00 |
|
Liam Green |
Herts Cubs |
4.50 |
|
Micky Watson |
Herts Red Sox |
6.00 |
|
Bradley Edgar |
Herts Blue Jays |
6.75 |
|
Rhys Whitney |
Herts Blue Jays |
10.80 |
Experts say that pitching wins ballgames. The Earned Run Average (ERA) is one of the best pitching indicators. It shows how many earned runs a pitcher allows on average over 9 innings ((Number of Earned Runs x 9) divided by (Number of Innings Pitched)).
|
PITCHING (OPPOSITION BATTING %)* |
||
|
Name |
Team |
OBA |
|
Liam Green |
Herts Cubs |
0.143 |
|
Jamie Paterson |
Herts Yankees |
0.250 |
|
Rhys Whitney |
Herts Blue Jays |
0.250 |
|
Lewis Green |
Herts Yankees |
0.375 |
|
Bradley Edgar |
Herts Blue Jays |
0.450 |
The Opposition Batting Average simply shows how well opponents bat against that particular pitcher. The lower the average, the more effective the pitcher.
* It is important to note that not all of the Herts Baseball Little League games were scored since the start of the 2009 season and therefore some player performances have not been reflected in the above stats. The Herts Little League will be aiming to score absolutely every league game in the coming years which would give us fascinating information about player and team performances just like they do it in Major League Baseball (click to view)

